Frotcom is constantly collecting data about your fleet’s performance. Now you can make sense of all this data in a single glance.
The Advanced Dashboard puts the power of Business Intelligence in your fingertips and allows you to see through your fleet’s data.
This advanced dashboard segments and prepares your fleet data in several different ways, helping you visualize and analyze your fleet’s performance over time.
You will have access to numerous dashboards, focusing on cost-saving, productivity and efficiency.
You will be able to see how your key performance indicators evolve in time, allowing to focus on the ones that need to be improved.
Frotcom’s Advanced Dashboard helps you answer these questions:
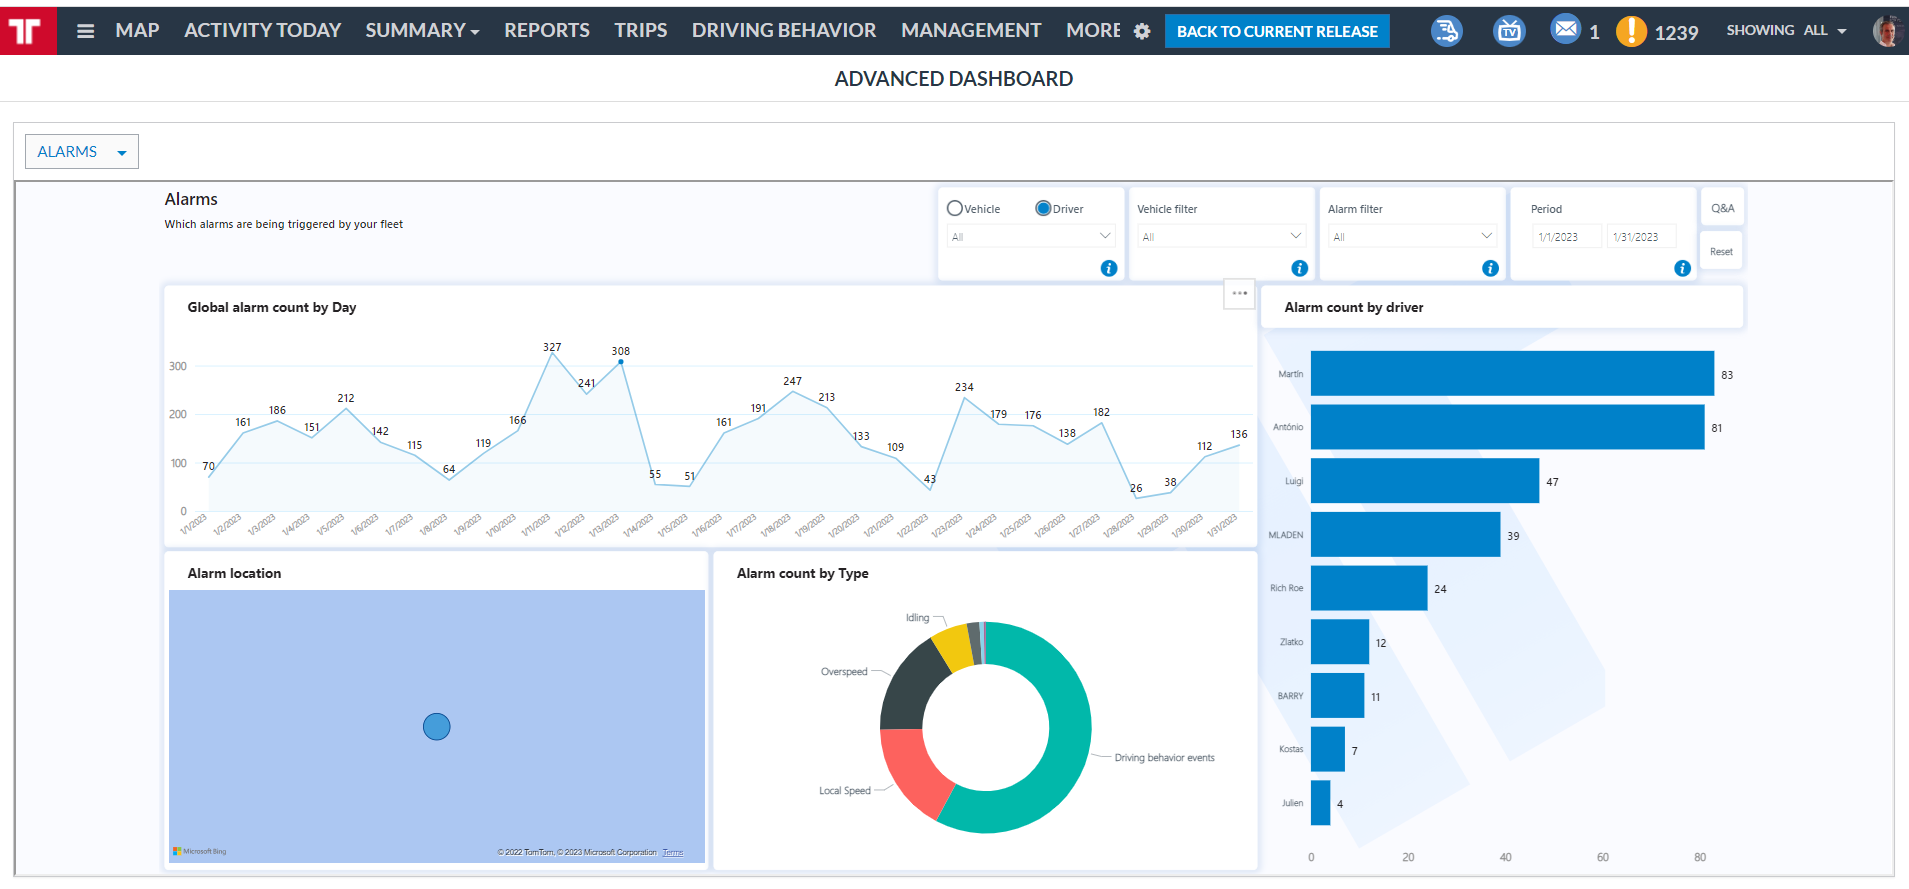
- Which alarms trigger more frequently and which vehicles and drivers trigger them?
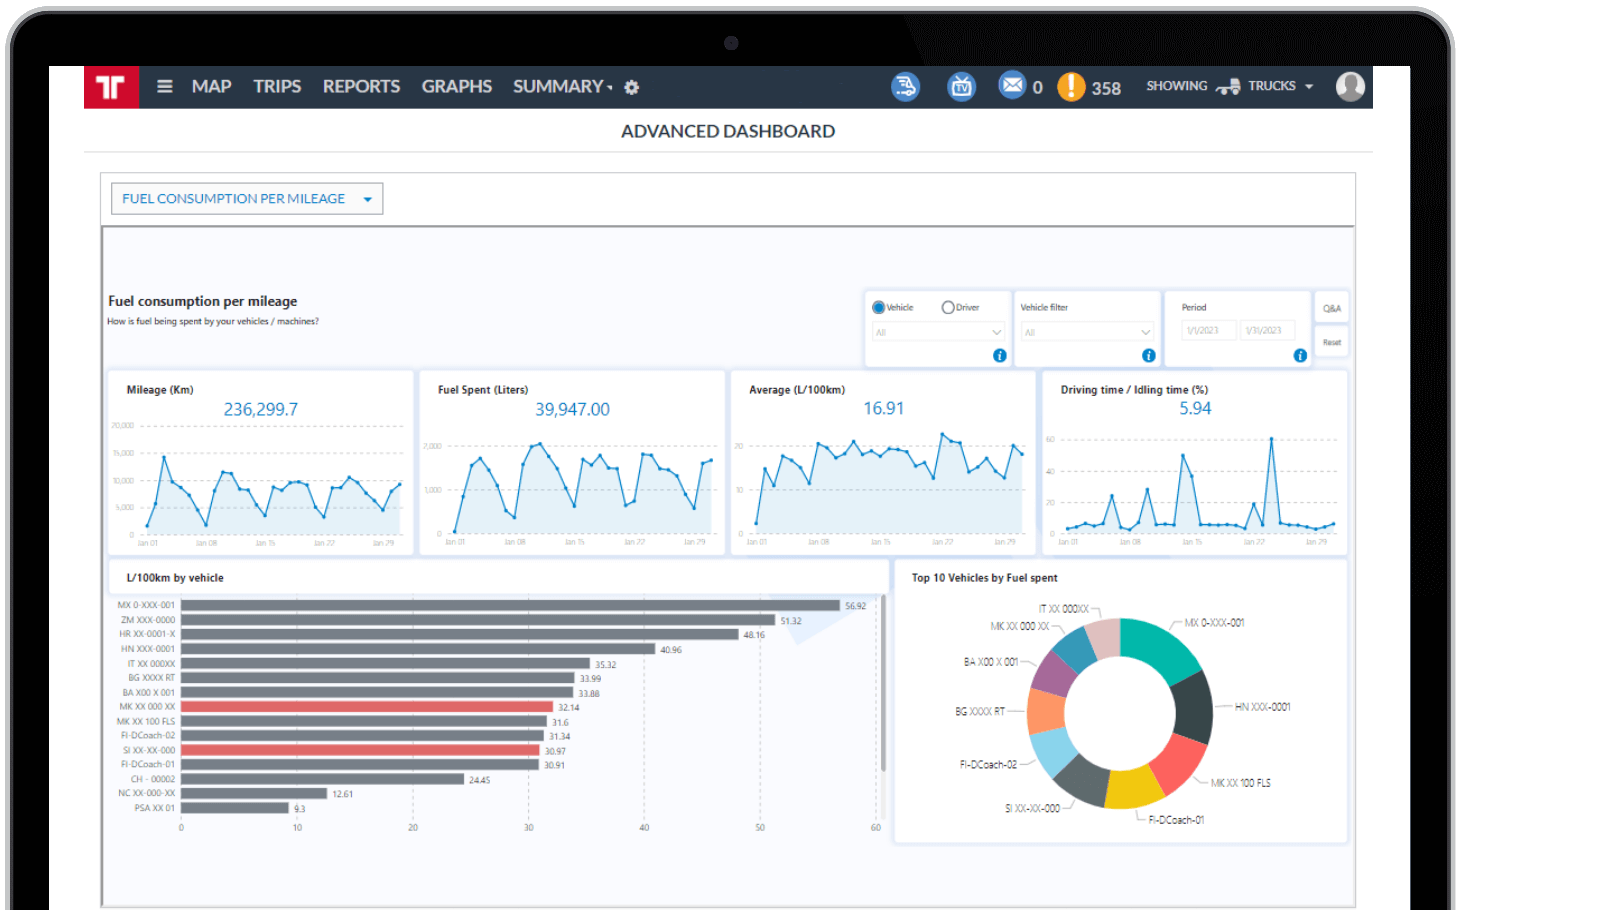
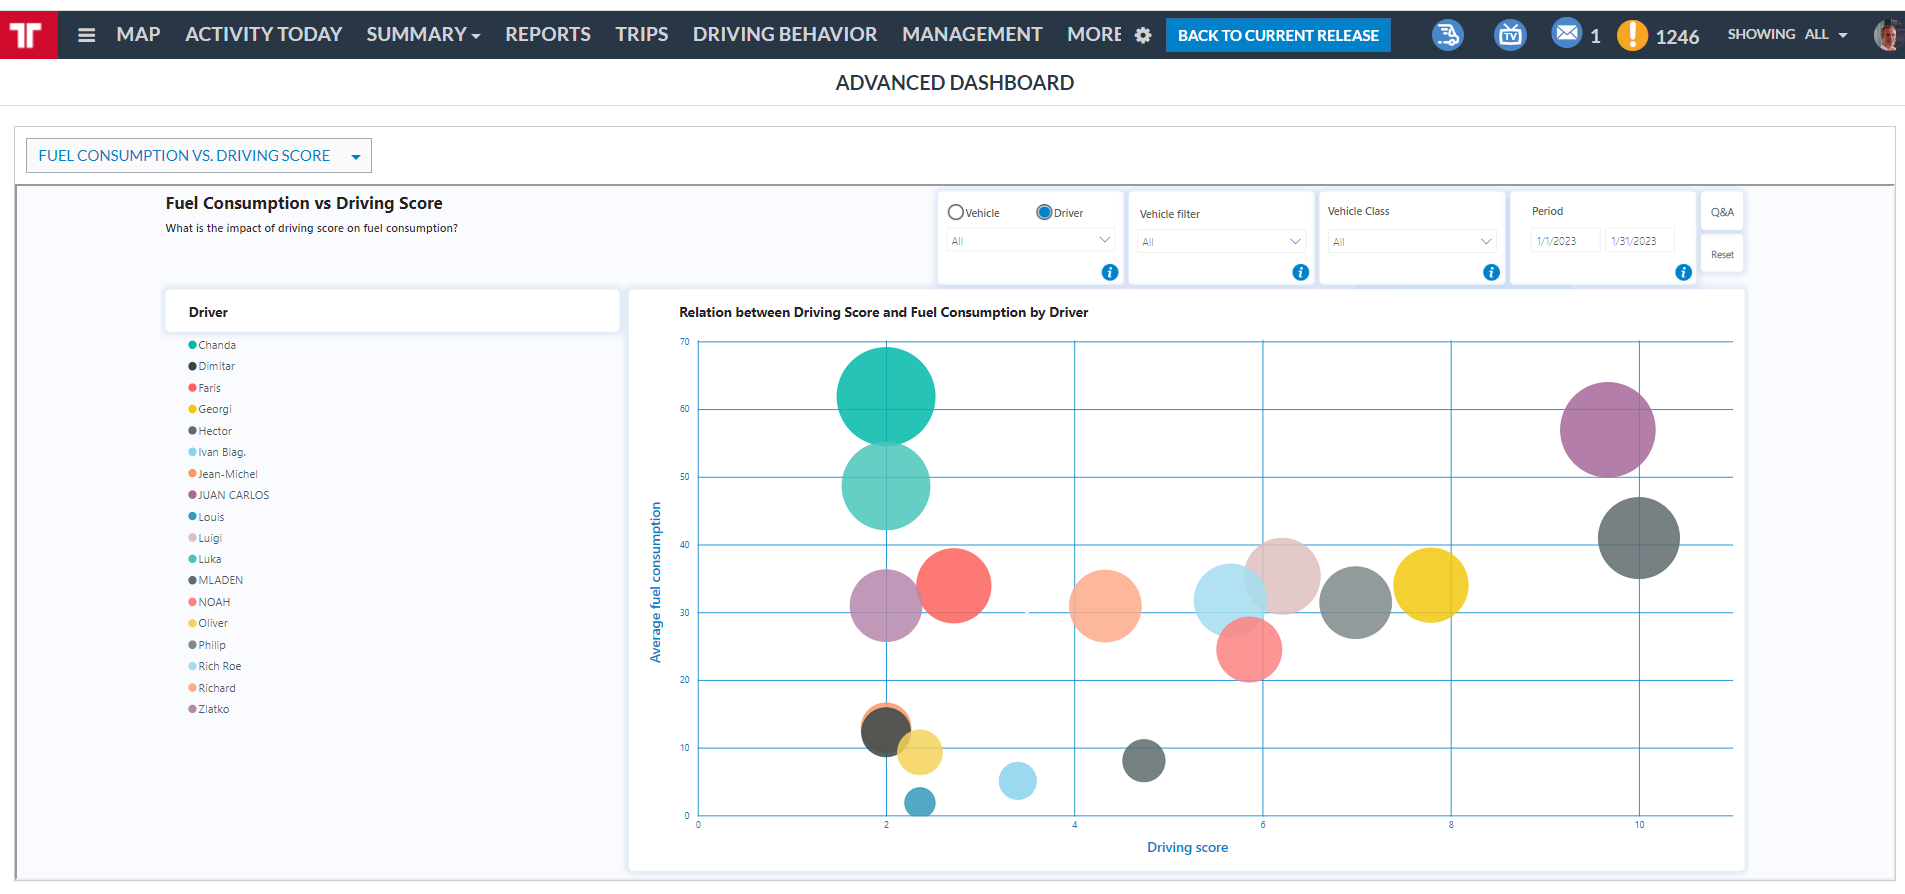
- Which vehicles and drivers spend more fuel per mileage?
- What is the relation between the driving score for each vehicle/driver and that vehicle’s fuel consumption?
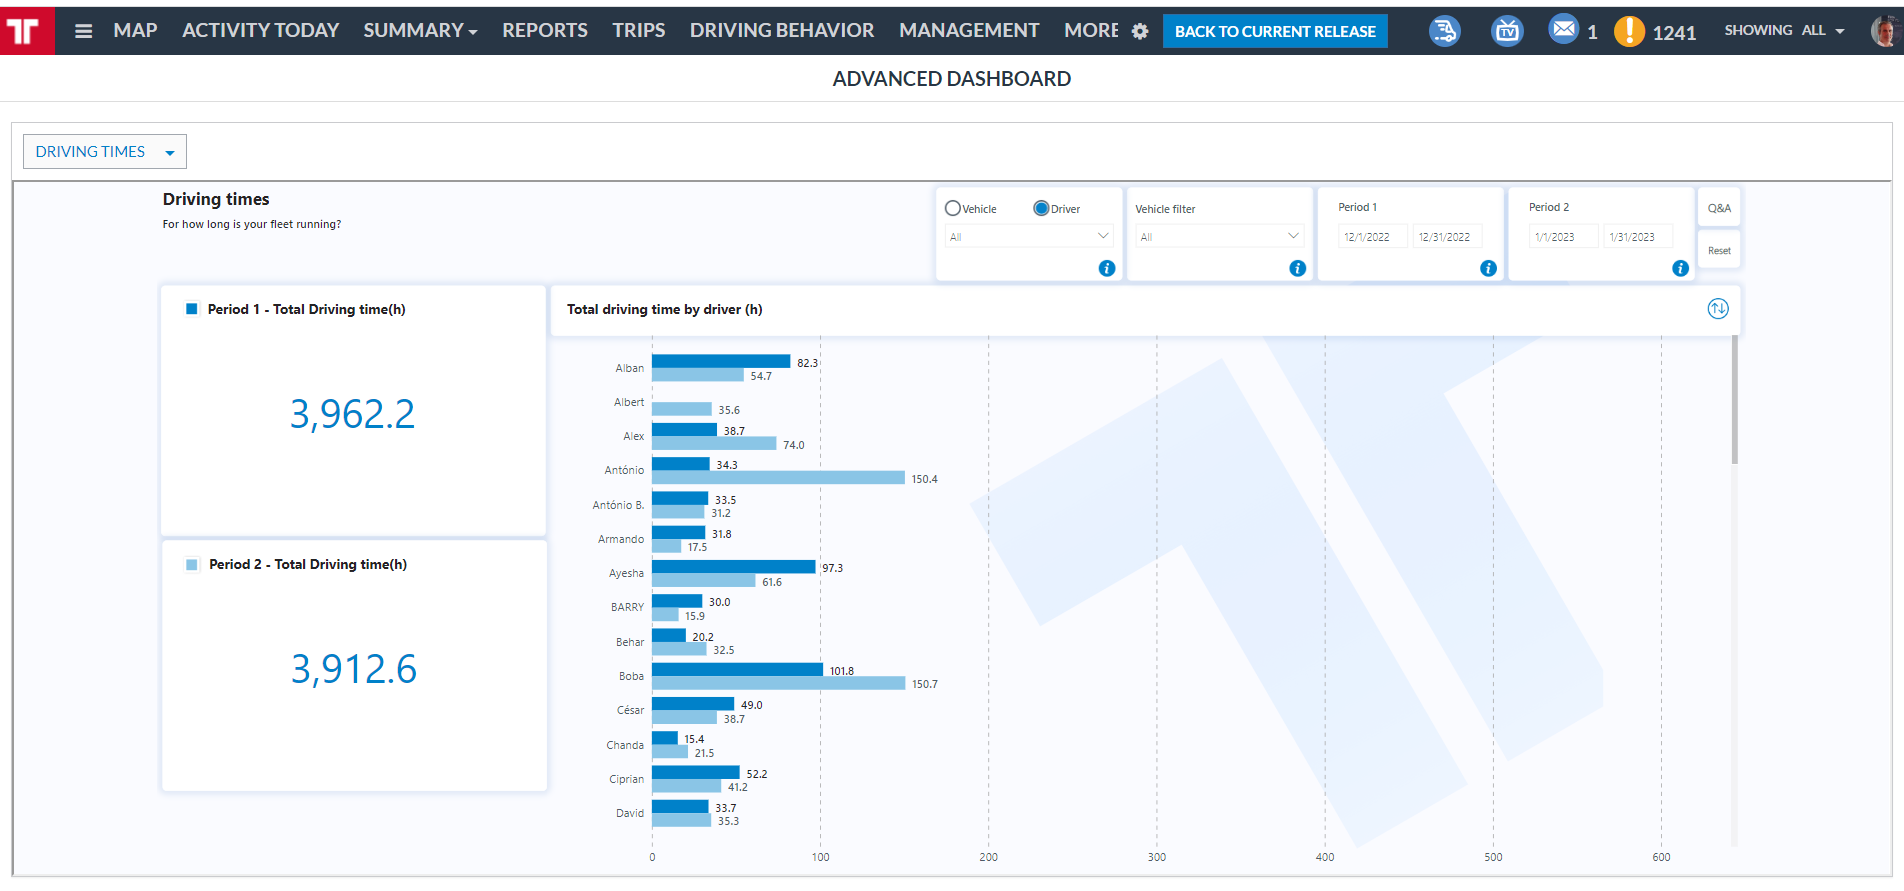
- Which vehicles/drivers have more mileage and driving times?
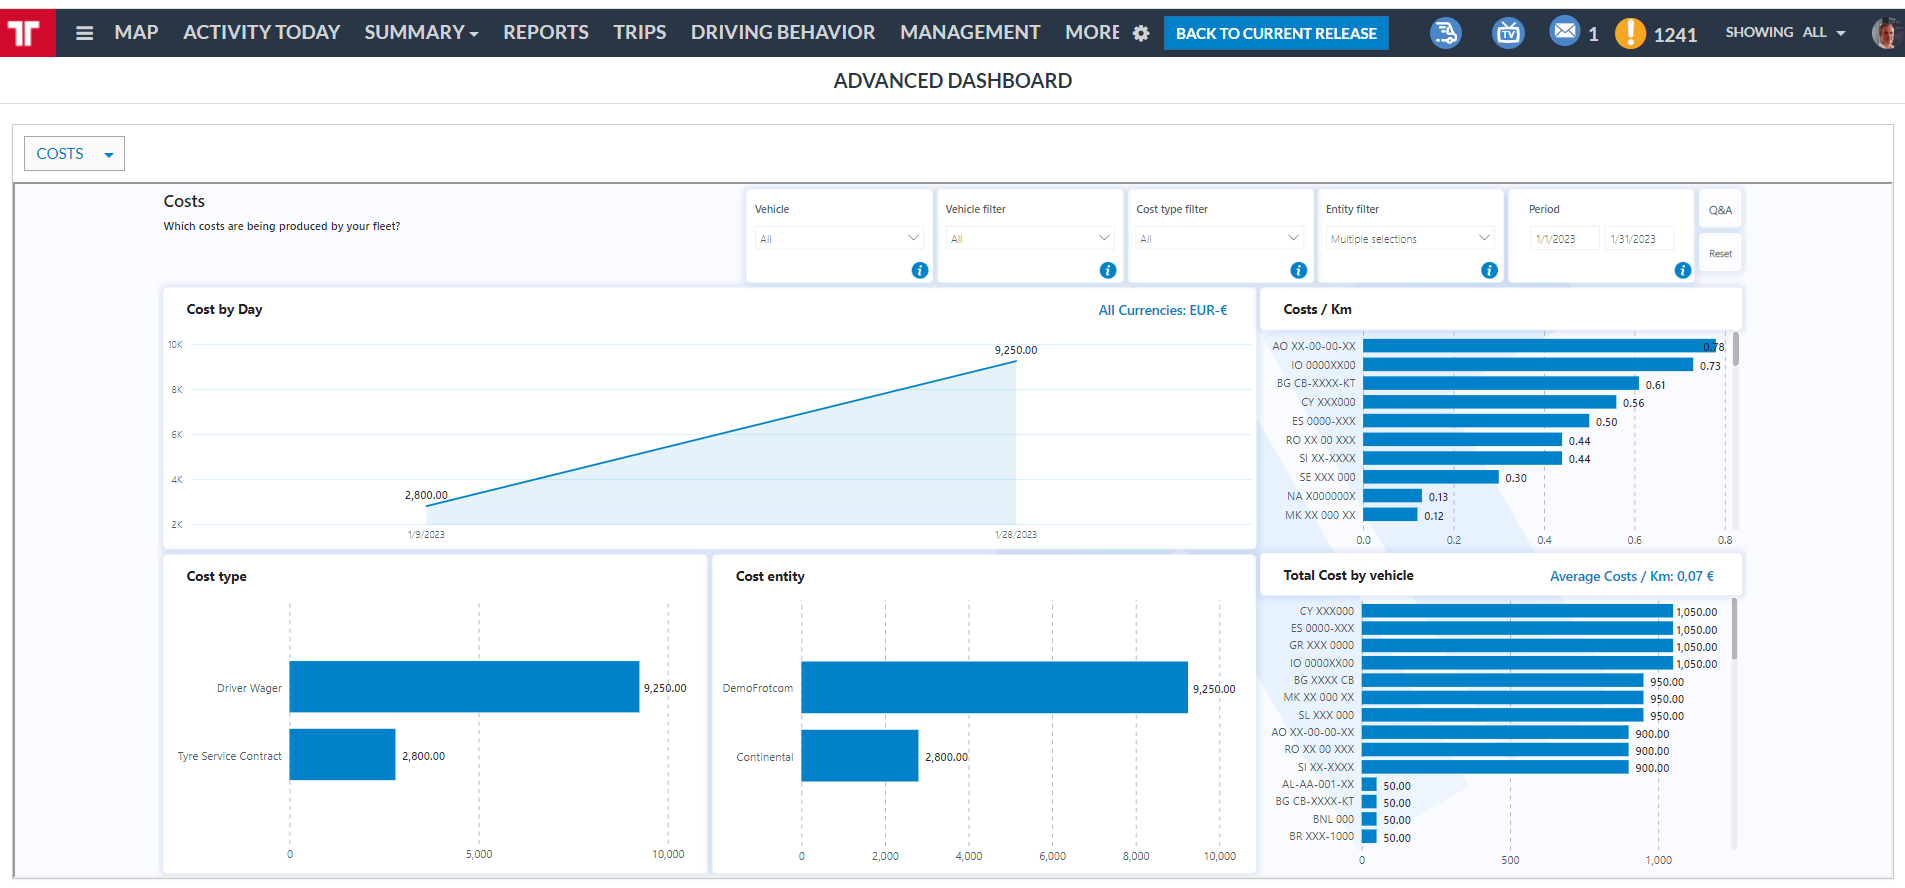
- Which vehicles represented the highest costs?
- How have these indicators evolved with time?
Once you activate the Advanced Dashboard option for your company, Frotcom will start classifying and preparing your fleet’s data to be visualized and analyzed by you.
All data collected by Frotcom about your fleet is prepared in advance, so that you can analyze it through the Advanced Dashboard.
Once data is prepared, you simply select the Advanced Dashboard option from the menu in Frotcom and proceed to the dashboard KPIs you want to see.
A selector allows you to move from one dashboard tab to another. Different KPIs are visible in different tabs.
There are numerous KPIs available and Frotcom is frequently adding new ones, KPIs are focused on Alarms, Costs, Driving time, Fuel consumption, Fuel consumption vs. Driving score, Logins, Mileage and Workload.
Inside each dashboard tab, you can check the information available and use filters and other selection tools to zero in on the data you want to examine.
In each dashboard tab, click on a variable to use it as filter and remove the previous filter.
For instance, if you click an alarm type, the dashboard will filter all information shown to be specific of that alarm type.
If you now click on a vehicle, the dashboard will forget about the selected alarm type and will show all the alarms corresponding to the selected vehicle.
Hold the CTRL key while clicking on a variable to use it as a filter while simultaneously keeping the previous filter.
For instance, if you click an alarm type, the dashboard will filter all information shown to be specific of that alarm type. If you now click on a vehicle while pressing the CTRL key, the dashboard will NOT forget about the selected alarm type and will show information about only that alarm, corresponding to the selected vehicle.
In other words, when you use the CTRL + click combination, you are drilling down information, without deselecting the previous filter.
Use the RESET button to clear all the filters at once.
Main features
- Several dashboard tabs available to examine multiple KPIs about your fleet’s performance.
- You are able to see and drill down on the KPIs.
- KPIs focus on Alarms, Costs, Driving time, Fuel consumption, Fuel consumption vs. Driving score, Logins, Mileage and Workload.
- More KPIs are frequently added to the Advanced Dashboard.
- Drill down by clicking on a single entity (for instance a vehicle) to see only information about that entity.
Have a look
Benefits
Measure and control the most important indicators
You will be able to know instantly how the most important indicators are evolving, so you can try and correct them when necessary.
Compare fuel consumption of vehicles
See in a glance which vehicles have the best and worst fuel consumption performance, which will help you choose better which makes and models to invest in.
Select and follow your preferred KPIs
Choose from the available dashboards the ones that interest you the most. Check them regularly to keep your fleet on track.
Set goals and move towards those goals
Since it is easy for you to measure these performance indicators, you can establish goals for your fleet.
